












At VRWS in Lyon on 8 October 2026, AirDNA chief economist Jamie Lane presented “Higher Rates, Fewer Nights”. We highlight Croatia-specific indicators, keeping measured results separate from our interpretation.
−10.4%
OTA nights · 12m / 06-2026
+6.6%
Average daily rate (ADR) · 12m / 08-2026
−2.1 pp
Occupancy · 12m / 08-2026
Croatia's official record year: how does it compare with AirDNA?
On 10 September 2026, Croatia's tourism ministry reported 17.5 million arrivals and 90.5 million nights from January to August, both up 1% in eVisitor data. On 30 September it reported a record €4.587 billion in foreign tourist receipts in the first half of 2026, nearly 5% more year on year. These are positive aggregate indicators, not a measurement of the average host's profit.
AirDNA's −10.4% applies to booked nights in homes listed on major OTAs and a different twelve-month period ending June 2026. eVisitor covers commercial and non-commercial accommodation and nautical tourism; the ministry's visitor figures run from January to August. They cannot be subtracted or treated as contradictory. Croatia's statistical office also reported −6.1% commercial nights in June but +1.2% in July 2026.
Sources and reporting periods
| Source |
Period |
Result |
|---|---|---|
| Ministry / eVisitor |
Jan–Aug 2026 |
90.5m total nights; +1% |
| Ministry / central bank |
Jan–Jun 2026 |
€4.587bn foreign tourist receipts; nearly +5% |
| AirDNA / major OTAs |
12 months to Jun 2026 |
Nights in listed homes; −10.4% |
| AirDNA / short-term rentals |
12 months to Aug 2026 |
Occupancy −2.1 pp; ADR +6.6% |
Access AirDNA slides (PDF, 43 pages)
Official link printed on AirDNA's final slide. Opens an external download page.
Access AirDNA slides (PDF, 43 pages) ↗
Our view: a record tourism year can be accurate for aggregate arrivals and receipts without meaning record occupancy or income for every holiday rental. Track property-level RevPAR, costs and distribution performance.
Croatian tourism ministry: record tourist year
Croatian tourism ministry: record receipts
Why OTA and official nights differ
For the twelve months ending June 2026, AirDNA reports 10.4% fewer nights sold by homes listed on major OTAs in Croatia. Eurostat's official nights across tourist accommodation grew 0.2%. These measure different accommodation populations; −10.4% is not a fall in total Croatian tourism.
Croatia and its neighbours
For the same OTA-night comparison, Albania grew 19.4%, Slovenia 6.0% and Montenegro 1.6%, versus Croatia's −10.4%. Competition is increasing, although this does not prove guests switched countries.
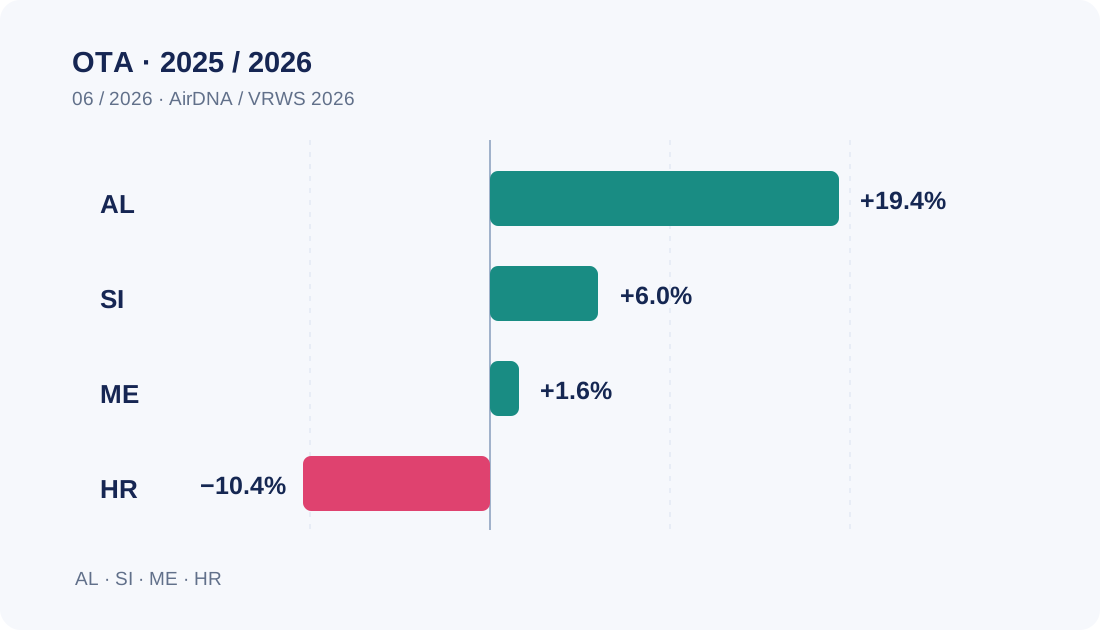
Year-on-year OTA nights, twelve months to June 2026. Source: AirDNA, VRWS 2026, slide 23.
Higher rates do not guarantee higher revenue
In the twelve months to August 2026, Croatian occupancy fell 2.1 percentage points while ADR increased 6.6%; available listings declined 2.4%. These periods and metrics should not be mixed into a single revenue estimate.
ADR is the average rate per sold night. Occupancy is the proportion of available nights sold. RevPAR is revenue per available rental night, combining rate and occupancy. A higher rate may be offset by fewer booked nights.
Dynamic pricing and professional management
AirDNA reports around 10% higher RevPAR for Croatian listings with high price variability versus comparable listings. This is an observed association, not a promised causal 10% uplift. Around 34% of European listings are PMS-connected, while about 12% show high price variability.
Practical steps for Croatian hosts
Monitor forward bookings, occupancy, revenue and costs; adjust rates to demand; assess each distribution channel and protect guest experience. Property and destination-level data matter more than national averages alone.
Why costs matter as much as nightly rates
Higher ADR combined with fewer bookings can leave gross revenue flat or lower. Cleaning, maintenance, energy, marketing and commissions also affect profitability. Managers should track RevPAR, net revenue and the cost per booking rather than equating national tourism receipts with an individual owner's profit.
What does a 2.1 percentage-point occupancy decline mean?
A loss of 2.1 percentage points is not the same as a 2.1% relative decline, nor does it apply uniformly to each property. Moving from 60% to 57.9% occupancy, for example, is a 2.1-point drop. Across 150 available nights this would represent roughly three fewer sold nights if availability were unchanged.
Interpreting growth in neighbouring markets
Positive OTA-night growth in Albania, Slovenia and Montenegro needs context: percentage change alone says little about the absolute market size or supply growth. Compare like-for-like properties, guest experience and value for money in each destination.
Actions for the next season
Review booking pace by arrival date and channel, identify calendar gaps, revisit minimum-stay rules and keep pricing responsive to demand. Shoulder seasons deserve particular attention, as a timely adjustment can be more valuable than setting the highest initial price.
Methodology and limitations
AirDNA captures properties on major booking platforms, not every direct or agency booking. eVisitor, the statistical office, Eurostat and the central bank use different definitions and reporting windows. MyRent's conclusions are an interpretation, not a claim that AirDNA measured the performance of every Croatian host.
MyRent's conclusion
Our view: Croatian rentals cannot rely on summer price increases alone. Revenue management, distribution and service quality will shape competitiveness. MyRent treats digitalisation as connecting reservations, pricing, guest communication and operations, not merely synchronising calendars.


